^^

Space Weather...

Go to Current Conditions, Reviews and Forecasts )  

Structure of the Sun and the Solar Wind

More about the Sun More about the Solar Wind

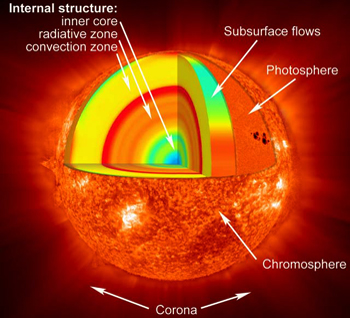
The Sun is the star at the center of our solar system. The sun has a diameter of about 1.392.000 kilometers (about 109 earths) and accounts for about 99.86% of our solar system's mass. The remainder consists of the planets (including earth), asteroids, meteoroids, comets, and dust in orbit. About three-quarters of the sun's mass consists of hydrogen, while most of the rest is helium. Less than 2% consists of other elements, including iron, oxygen, carbon, neon, and others. The sun is one of the main sequence second generation star, spectral type G2V, that has more mass and temperature than in an average star, but significantly less than a blue giant and produces energy from his inside hydrogen fusion. The lifetime of a G2 star main sequence is around 10 billion years. The age of the sun is estimated at 5 billion years. Elaborate tests showed that the shape of the Sun is almost a perfect sphere with an average diameter of 1.392.000 km, about 109 times that of Earth, with a widening of about 9 millionths, which is mainly due to the gravity of Jupiter. Full sphericity of the Sun is explained by his slow rotation. The visual and spectroscopic examination showed, that the solar sphere rotates on its axis from west to east and the required rotation time reaches on average 25 days and 23 minutes. But this time is not stable at all points of his surface. So near the solar equator is limited to 24 days and 15 hours, within 45° from the equator it reaches approximately 28.5 days, while at the poles this time is even greater. The sun follows a path on the milky way at a distance of 25,000 to 28,000 light years from the center. Completes a procession at about 226 million years. Around the sun are the orbits of the 8 known planets with their satellites and other bodies such as asteroids and comets. The earth is the third planet from the sun.


A beautiful prominence eruption producing a Coronal Mass Ejection (CME) on the east limb (left side) of the sun on 16 April 2012.
Such eruptions are often associated with solar flares. In this case an M1 class (medium-sized) flare occurred at the same time,
peaking at 1:45 PM EDT (Eastern Daylight Time). This Coronal Mass Ejection was not aimed toward Earth.
(Source: NASA)

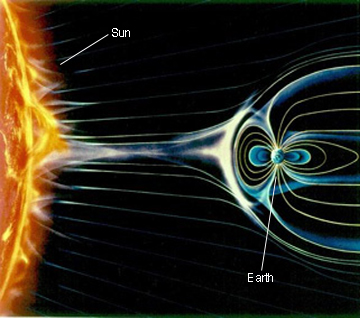
The heat of dilute plasma corona is so high as to overcome the gravitational field of the sun and expands to the interplanetary space in the form of wind. The Solar Wind has been identified and as solar corpuscular radiation consists mainly of electrons and protons emitted almost radially from the crown of the sun at supersonic speeds. The stemmatikes holes are the main points of escape and acceleration of the solar wind since stemmatikes holes are located in areas characterized by open magnetic lines, low temperature and density compared with the corresponding values of the crown. The solar wind leaps from different points on the surface of the sun with a different initial velocity due to different conditions in the area holes and therefore the rotation of the sun reaches the earth in gusts or otherwise as currents or waves of solar wind.


The music is driven by Solar Wind Data that was captured by the ACE satellite during the year 2003,
through an interpretive process known as Sonification. The video clip has been arranged such that
auditory events often correspond visually to Solar Flares.
(Creator: Robert Alexander)

Solar Cycle

More about solar cycle progression from NOAA

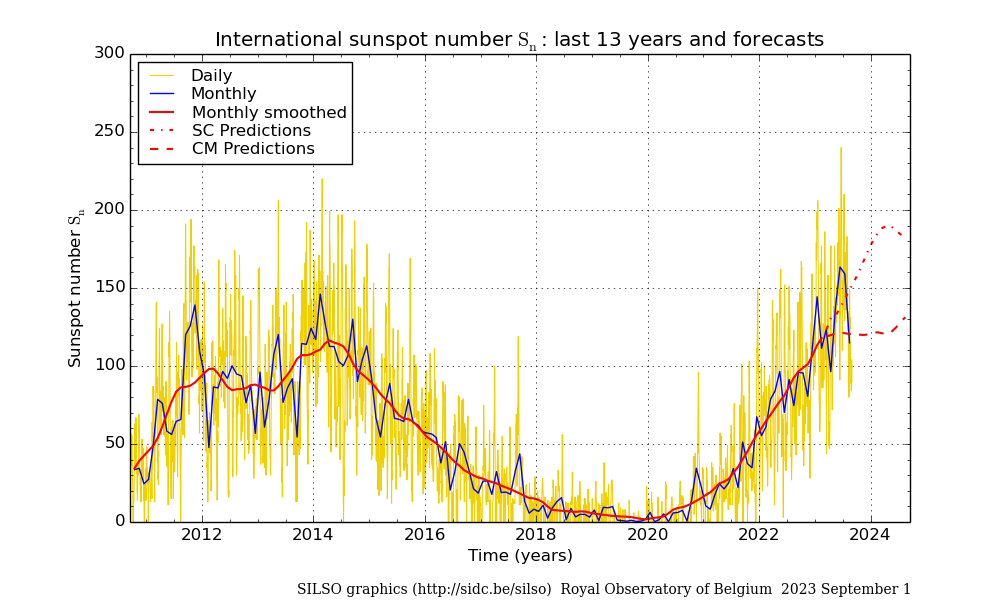
Solar Cycle Progression
(Source: Royal Observatory of Belgium)

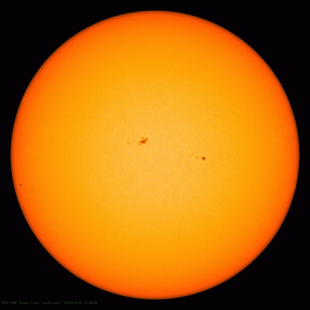
SDO/HMI Continuum spectra filtergram image
Broad wavelength photograph of the photosphere
with sunspot regions Source: sdo.gsfc.nasa.gov

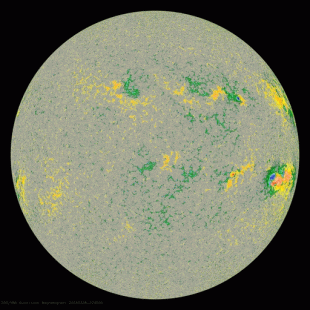
SDO/HMI Vector magnetogram image
Pictorial map of the photospheric magnetic field
with sunspot regions Source: sdo.gsfc.nasa.gov

The Solar Cycle is observed by counting the frequency and placement of sunspots visible on the Sun. Was discovered in 1843 by Samuel Heinrich Schwabe, who after 17 years of observations noticed a periodic variation in the average number of sunspots seen from year to year on the solar disk. Rudolf Wolf compiled and studied these and other observations, reconstructing the cycle back to 1745. Eventually pushing these reconstructions to the earliest observations of sunspots by Galileo and contemporaries in the early seventeenth century. Starting with Wolf, astronomers have found it useful to define a standard sunspot number index, the Wolf number, which continues to be used till today.
Until recently it was thought that there were 28 cycles in the 309 years between 1699 and 2008, giving an average length of 11.04 years per cycle. Recent research however, has showed that the longest of these (1784–1799) seems actually to have been two cycles, so that the average length is around 10.66 years. Cycles as short as 9 years and as long as 14 years have been observed, and in the double cycle of (1784-1799) one of the two cycles, had to be less than 8 years in length. Significant variations in sunspots amplitude also occur.
Solar maximum and solar minimum refer respectively to epochs of maximum and minimum sunspot counts. Sunspot cycles are separated from each other from one minimum sunspot count to the next. Following the numbering scheme established by Wolf, the (1755-1766) cycle is traditionally numbered as the first.
In the period between 1645 and 1715 very few sunspots were observed. This epoch of about 80 years is known as the Maunder Minimum, after Edward-Walter Maunder who extensively researched this peculiar event, first noted by Gustav Spoerer. The Maunder Minimum coincided with the middle and coldest part of the Little Ice Age. During this age, Europe and North America were subjected to bitterly cold winters. The lakes in Northern Italy, the Netherlands and even the Thames freezes every winter and several wars took place in Europe since the fields were not yielded the expected. At this epoch is also the Golden Period of Antonio Stradivari. In a quite reasonable theory, the particular sound of his stringed instruments is, in addition to design, the use of spruce that had been developed at this time. The special climatic conditions with the very cold winters and the cooler summers, developed wood that had slower and more even growth, important elements to produce higher quality sounding boards.
Similar phenomenon with shorter duration, was recorded between 1790 and 1830, known as the Dalton Minimum. During this period at 1816, in conjunction with the eruption of Mount Tabora in Indonesia in 1815, is the known Year Without Summer. This summer caused, by his climate abnormalities, agricultural disaster in the northern hemisphere.
A causal connection between low sunspot activity and cold winters has recently been made and shows that solar UV output is more variable over the course of the solar cycle than scientists had previously thought.


Evolution of magnetism on the sun
Wikipedia about the solar cycle
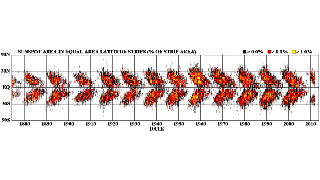
The sunspot butterfly diagram

In the second half of the nineteenth century it was also noted, by Richard Carrington and by Gustav Spoerer, that as the cycle progresses, sunspots appear first at mid-latitudes and then closer and closer to the equator until solar minimum is reached. This pattern is best visualized in the form of the so called butterfly diagram, first constructed by the couple of Edward-Walter and Annie Maunder in the early twentieth century.
In 1908, George-Ellery Hale and collaborators, showed that sunspots were strongly magnetized (this was the first detection of magnetic fields outside the Earth) and in 1919 went on to show that the magnetic polarity of sunspot pairs is always the same in a given solar hemisphere throughout a sunspot cycle, is opposite across hemispheres throughout a cycle and reverses itself in both hemispheres from one sunspot cycle to the next.
Hale's observations revealed that the solar cycle is actually a magnetic cycle with an average duration of 22 years, during which at approximately 11 years the magnetic poles of the sun reverses and at approximately 22 years go back to their original condition.

Wikipedia about the solar magnetic field
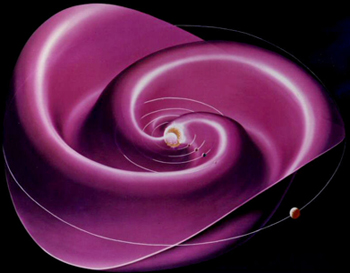
Sun's rotating interplanetary magnetic field

Heliospheric current sheet from 2001 till 2009
The solar magnetic field extends well beyond the Sun itself. The magnetized solar wind plasma carries the Sun's magnetic field into space forming what is called the interplanetary magnetic field (IMF). Since the plasma can only move along the magnetic field lines, the IMF is initially stretched radially away from the Sun. Because the fields above and below the solar equator have different polarities pointing towards and away from the Sun, there exists a thin current layer in the solar equatorial plane, which is called the Heliospheric Current Sheet. At great distances, the rotation of the Sun twists the magnetic field and the current sheet into the Archimedean spiral like structure called the Parker spiral. The IMF is much stronger than the dipole component of the solar magnetic field. The Sun's dipole magnetic field of 50–400 μT (at the photosphere) reduces with the cube of the distance to about 0.1 nT at the distance of the Earth. However, according to spacecraft observations the IMF at the Earth's location is around 5 nT, about a hundred times greater. The difference is due to magnetic fields generated by electrical currents in the plasma surrounding the Sun.

However, because almost all solar events are observed based on sunspots and not his magnetic polarity, it remains common usage to speak of the 11year solar cycle.
At the time where these lines are written, in May 2013, we are in the 24th solar cycle which started in January 2008. The activity so far seems to be the least active cycle in the last 100 years. In a study is shown that the up to now diagram of sunspots has similarities to the Maunder Minimum diagram. This may mean that we are at the beginning of a repeat of the Little Ice Age. Which will be strongly visible in the next 50 years.

Real Time Images of the Sun

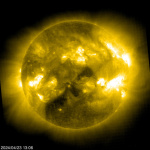
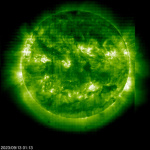
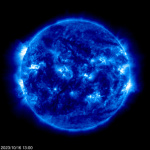
Click for time-lapse image of the sun (large file) (304 Angstr. - 80.000 Kelv.) SOHO EIT 284 image of the sun (284 Angstr. - 2 mil Kelv.) SOHO EIT 284 image of the sun (195 Angstr. - 1,5 mil Kelv.) SOHO EIT 284 image of the sun (171 Angstr. - 1 mil Kelv.) Click for time-lapse image of the Sun's Corona (large file) (LASCO C2 Coronagraph)
(Source: soho.nascom.nasa.gov)

The sun is constantly monitored for Sun Spots and Coronal Mass Ejections. EIT (Extreme ultraviolet Imaging Telescope) images the solar atmosphere at several wavelengths and therefore, shows solar material at different temperatures. In the images taken at 304 Angstrom the bright material is at 60,000 to 80,000 degrees Kelvin. In those taken at 171 Angstrom, at 1 million degrees. 195 Angstrom images correspond to about 1.5 million Kelvin, 284 Angstrom to 2 million degrees. The hotter the temperature, the higher you look in the solar atmosphere.

What is the message CCD BAKEOUT ?


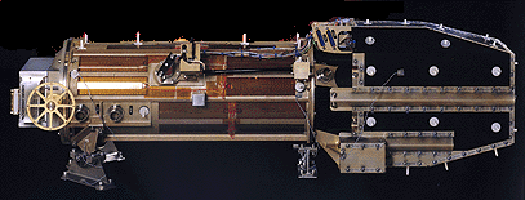
(SOHO's EIT telescope)

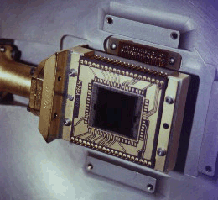
(EIT's telescope CCD)

If the images shown on "Real Time Images of the Sun" display the message CCD BAKEOUT, then this means EIT (Extreme ultraviolet Imaging Telescope) images are temporarily unavailable. In this case, there is nothing wrong with the EIT instrument on SOHO spacecraft. The images will resume within 2-3 weeks. CCD BAKEOUT is a procedure where the EIT on SOHO is taken offline in order to maintain the performance of the instrument. Bakeout is an artificial acceleration of the process of outgassing by heating.
The detector in EIT, on SOHO, is a, very expensive to produce, backside illuminated and thinned down to a thickness of about 10 microns charge coupled detector (CCD). The EIT CCD is similar to the, cheap to produce, frontside CCD's handheld video cameras, but with better read noise (the "snow" you see in your home videos when there's little available light) and, thanks to the backside-thinning, it's sensitive to extreme ultraviolet (EUV) light.
In order to keep read noise down (suppress the "snow") and to prevent cosmic ray hits from permanently raising the read noise level, by damaging the detector, the EIT CCD is usually operated at a temperature of about -67°C. This temperature is achieved by passive cooling. So the CCD chip is thermally contacted to a titanium "cold finger" (at far left in the right image above) that is attached to a radiator plate that is pointed at a piece of sky perpendicular to the Earth-Sun line.
Unfortunately, there's a small amount of "slush," probably a mixture of water vapor and hydrocarbons, that avoided the initial bakeout of the instrument. The back end of the EIT telescope, is a difficult place from which to escape, because of the plate holding the final, thin aluminum filter just in front of the CCD, and a labyrinthine venting system (designed to prevent stray light). At -67°C, even with the low partial pressure in space, the slush condenses on the CCD and the cold finger (they're the coldest parts of the back end of the instrument). The slush absorbs some EUV light and so reduces the throughput of the instrument. In addition, overexposure to EUV (say, from bright flares or, before the onboard software was fixed to prevent this, accidentally long exposures) can produce electron traps in the CCD material, which reduce the detector's throughput (how many electrons it produces for a given number of photons striking a pixel).
Thus, we need to warm up (bakeout) the detector to evaporate the slush (if only temporarily) and anneal out the electron traps in order to maintain the performance of the instrument.

spacer

Real Time Solar Wind

(PIXIE-Polar Ionospheric X-ray Imaging Experiment)
Space Weather Dials Interpretation GuideSpace Weather Dials Interpretation GuideSpace Weather Dials Interpretation GuideSpace Weather Dials Interpretation GuideSpace Weather Dials Interpretation Guide
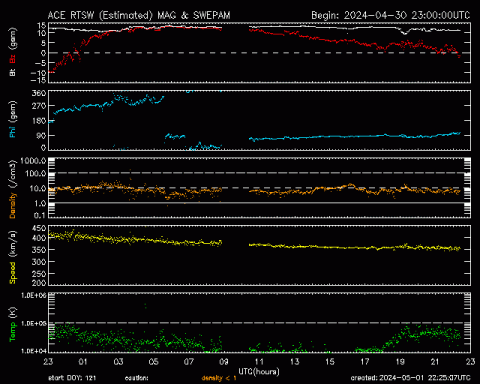
(Real-Time Solar Wind data broadcast from NASA's ACE satellite)

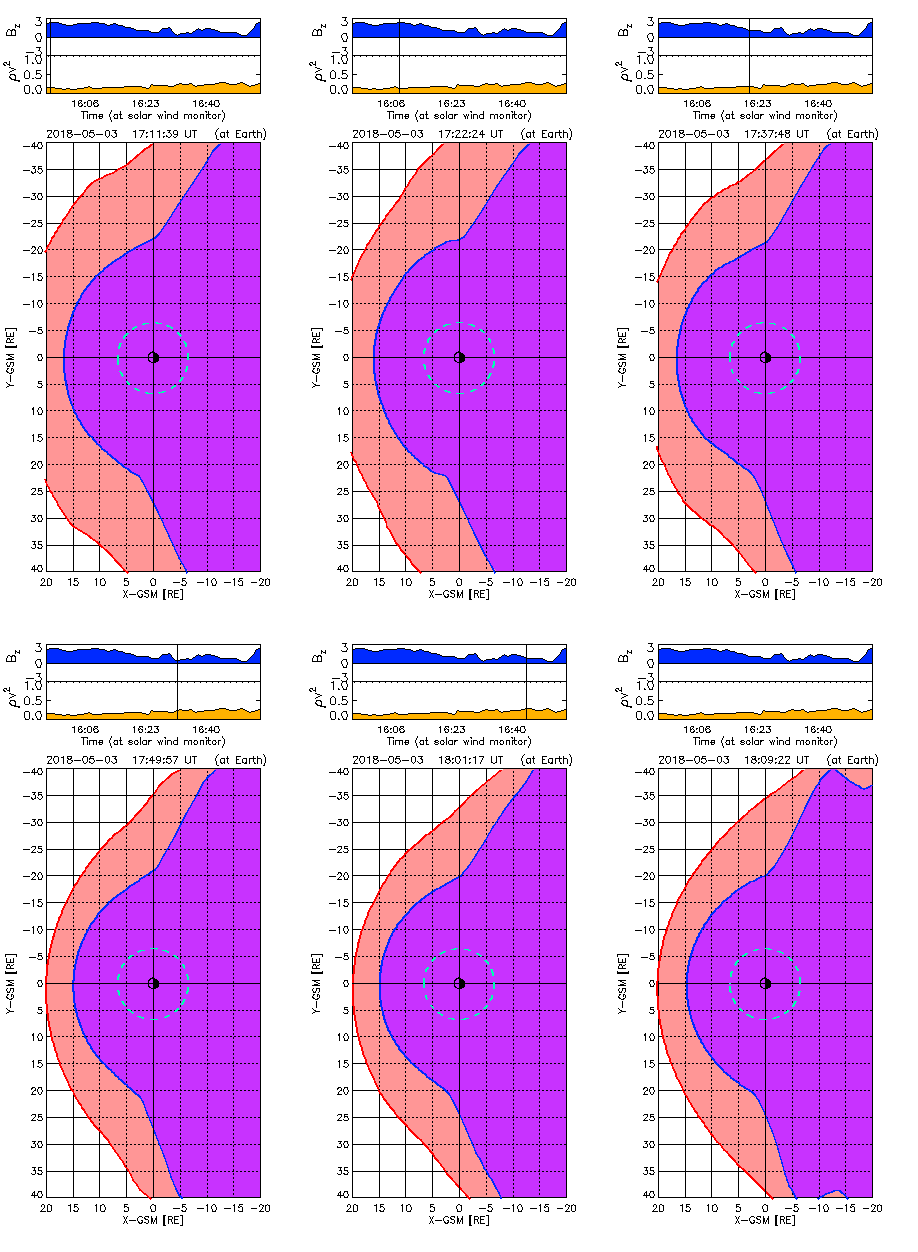
24-hour measurements of Solar Wind (24-hour measurements of Solar Wind. Speed, Bz, Dynamic Pressure, Kp-Index, Coronal Holes)

In the picture left, from 03-05-2018, the earth is on the center and right from the sun, which is not shown. Also we are looking down upon the North pole. Thus the figure represents the equatorial plane. The green dashed circle shows the orbit of many geosynchronous meteorological and communications satellites. The solar wind reaches the limits of the earth's magnetic field, where a wave disturbance is formed (red line). So as it flows through this disturbance, slows down and the pressure is balanced by the pressure of earth's magnetic field. The point at which this balance takes place is called magnetopause (blue line). Data from NASA's ACE (Advanced Composition Explorer) satellite are used to calculate the form and position of magnetopause and the disorder arcs in real time, but also to predict them for the next nearby period (Greenwich time). The ACE satellite measures the solar wind at a point from the earth to the sun at a distance of about 200 earth radii, about 1.5 million km from Earth and 148.5 million km from the Sun. The data allow us to predict several minutes before the solar wind reaches us, what will happen on earth. Significant values of the solar wind obtained from the ACE satellite is-z component of interplanetary magnetic field (Bz) measured in nano-Tesla, the dynamic pressure (also called the momentum flux) of the solar wind measured in nano-Pascal and the speed of the solar wind measured in km/sec.

Real Time Solar X-ray

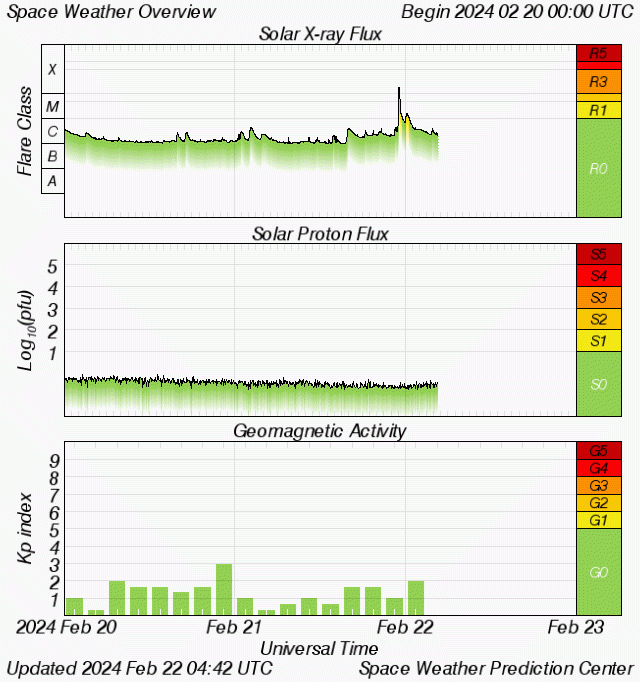
Graph showing Real-Time Solar X-ray Flux at SWPC-NOAA
These plots provide a quick look at some of the most frequently examined space weather indices

 NOAA Space Weather Scales    

When there is an episodic solar activity, than there are also effects. An occasional hazard for astronauts and for electronics on satellites and spacecrafts, which depends from the radiation dose from the energetic particles. The disturbances of the geomagnetic field may damage power systems, disrupt communications, degrade high-tech navigation systems, or create the spectacular Northern and Southern aurora. Flares (sudden brightenings) affect the ionosphere immediately, with adverse effects upon communications and radio navigation (GPS and LORAN). Accompanying radio bursts from the Sun are expected to exceed cell phone system noise tolerances 2-3 times per solar cycle. Solar energetic particles arrive in 20 minutes to several hours, threatening the electronics of spacecraft and unprotected astronauts, as they rise to 10,000 times the quiet background flux. Ejected bulk plasma and its pervading magnetic field arrive in 30 - 72 hours (depending upon initial speed and deceleration) setting off a geomagnetic storm, causing currents to flow in the magnetosphere and particles to be energized. The currents cause atmospheric heating and increased drag for satellite operators. They also induce voltages and currents in long conductors at ground level, adversely affecting pipelines and electric power grids. The energetic particles cause deep dielectric charging of spacecraft. Subsequent electrostatic discharge of the excess charge build-up can damage spacecraft electronics. The ionosphere departs from its normal state, due to the currents and the energetic particles, thereby adversely affecting communications and radionavigation. SWPC provides Alerts of these events and there are also the NOAA Space Weather Scales Here to have a better picture.

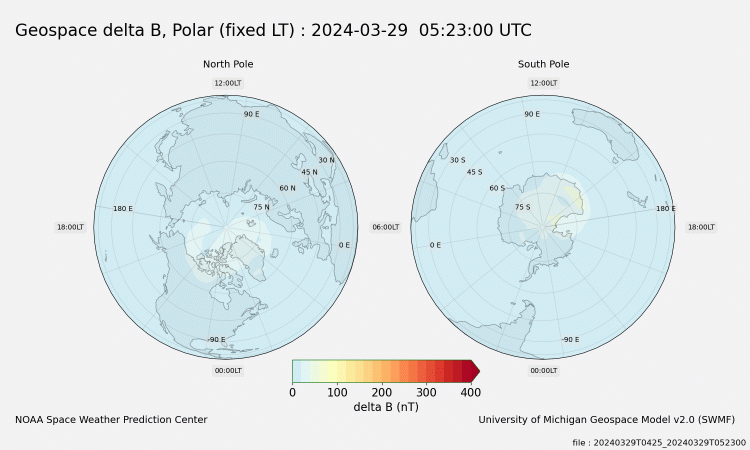
Ground Magnetic Perturbation

Space Weather Dials Interpretation Guide

Space Weather Dials Interpretation Guide

Space Weather Dials Interpretation Guide

Space Weather Dials Interpretation Guide

Source: www.swpc.noaa.gov

The Ground Magnetic Perturbation maps display the magnetic delta B (nT) output from the University of Michigan's Geospace model, which provides regional magnetic variations on a five by five degree global grid. Using these data, colored contour plots of the predicted delta B are generated for a dual polar view of the north and southern hemispheres oriented in fixed local time. The lead time depends on the solar wind speed, as well as the previous two hours for context. Ground magnetic perturbation maps such as those displayed here, are useful for providing regional disturbance model forecasts that can be used by power grid operators to determine if disturbances are likely to have impacts at their general location. This product uses output generated by the University of Michigan's Geospace model that consists of several components in their Space Weather Modeling Framework (SWMF). The Geospace model is a first-principles physics based model which includes three components. The University of Michigan's BATS-R-US magnetohydrodynamic (MHD) model of the magnetosphere, the Ridley Ionosphere electrodynamics Model (RIM) developed at Michigan and the Rice Convection Model (RCM), an inner magnetosphere ring-current model developed at Rice University.


The Auroral Creation
(University of Oslo)

Space Weather Images and Information (excluded from ©) courtesy of:
NOAA - NWS Space Weather Prediction Center
Mauna Loa Solar Observatory (HAO/NCAR)
SOHO (ESA & NASA)

   This data is not to be used for protection of life and property  
GO TO IONIA GO TO KALAMATA GO TO KIFISSIA GO TO SYROS GO TO DEXAMENI (BOLTEK) GO TO DEXAMENI (LR) GO TO LARISSA General Secretariat for Civil Protection European Emergency Call Number Video for Kastelorizo(Megisti) from ERT(state-TV) archives Municipality of Megisti website See it bigger